GIS Capstone
More information coming soon!
Time Series Analysis: Visualizing El Niño Events Across the Pacific Ocean
El Niño events are increasing in intensity as climate change continues to worsen. By using remote sensing, I visualize El Niño events over a span of twenty years, which is all the remotely sensed sea surface temperature data available, to see if increased intensity could be visualized over time. The biggest challenge I faced in this assignment was using data we had not previously used in the Remote Sensing class. To overcome this challenge I met with my professor multiple times for advice and found online resources on how to use the data properly. Through problem solving, I was able to complete my project on a topic I was interested in even with the elevated challenge of using a new dataset. The data available came in yearly, monthly, or eight day intervals, due to time and resources I had to choose the monthly data, which totaled 244 layers I to work with. I believe this and the fact that there are only twenty years worth of remotely sensed sea surface temperature were my biggest set backs. If I were given more time and a computer with more processing power, I would use the eight day data and expand my dataset beyond the MODIS data I discussed using in my project. This project allowed me to learn through my decision making, as I chose one route, knowing it would give me the best results with the resources I had, but learned how I could improve my project going a different route. Not only did I have to present the results of my project, but the entire process of why I chose the dataset I did, how I used it, and my methods of analyzing that data. Being able to effectively communicate the process of a project is important to science and this experience taught me how to communicate all aspects of my research.
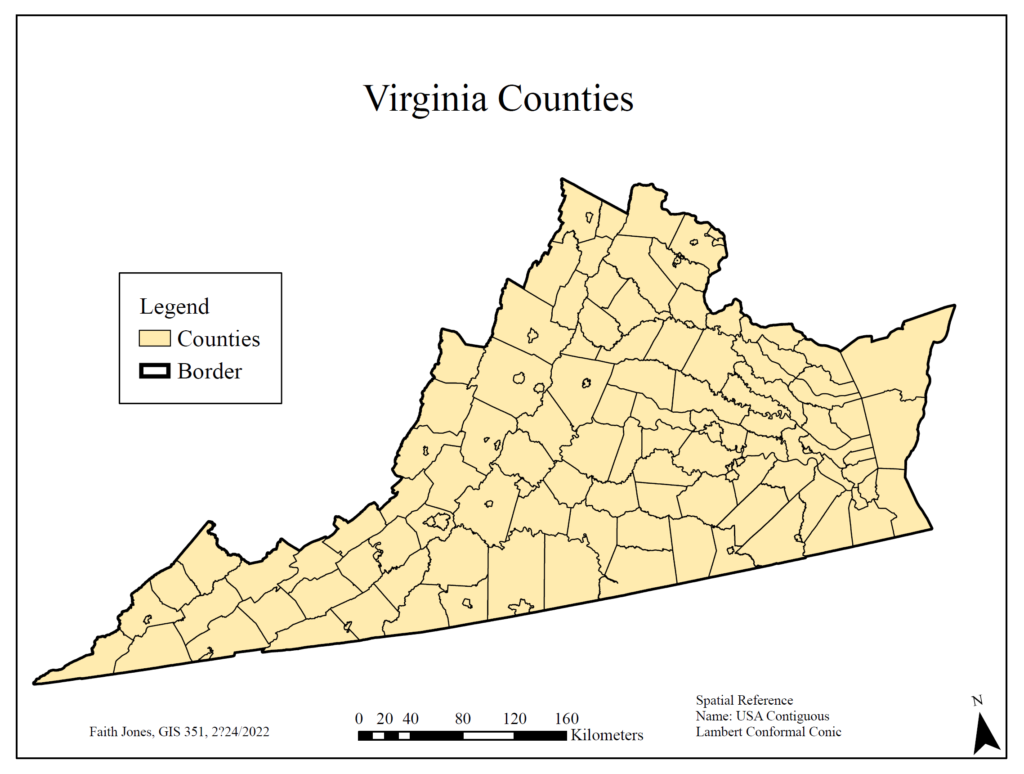
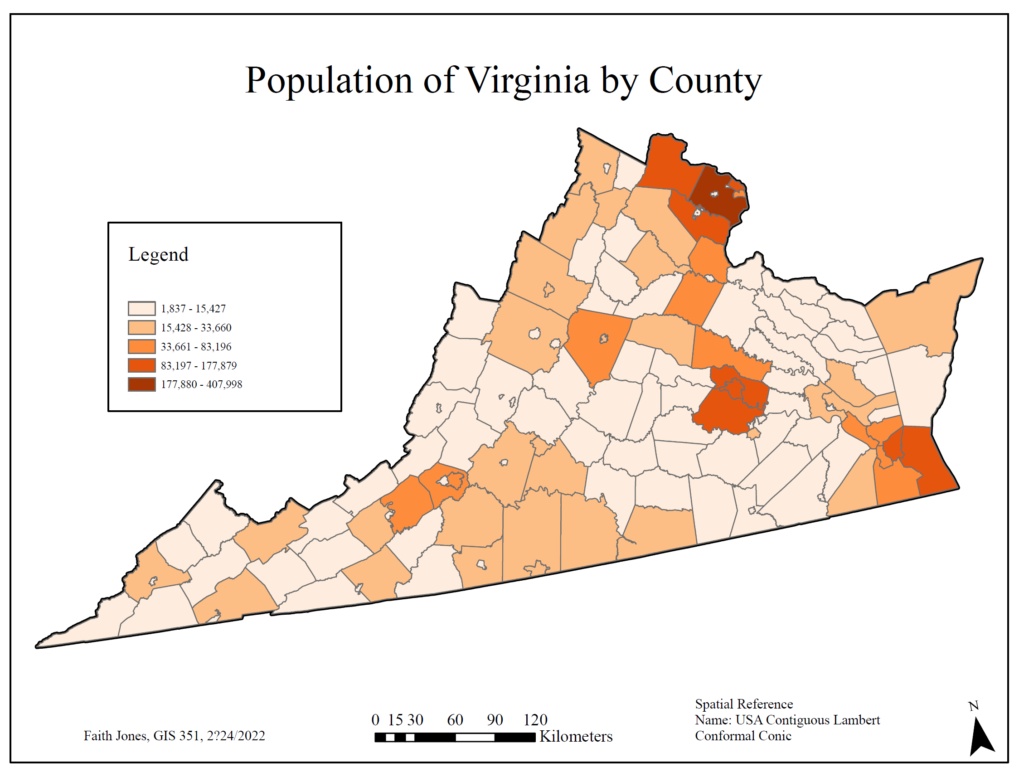
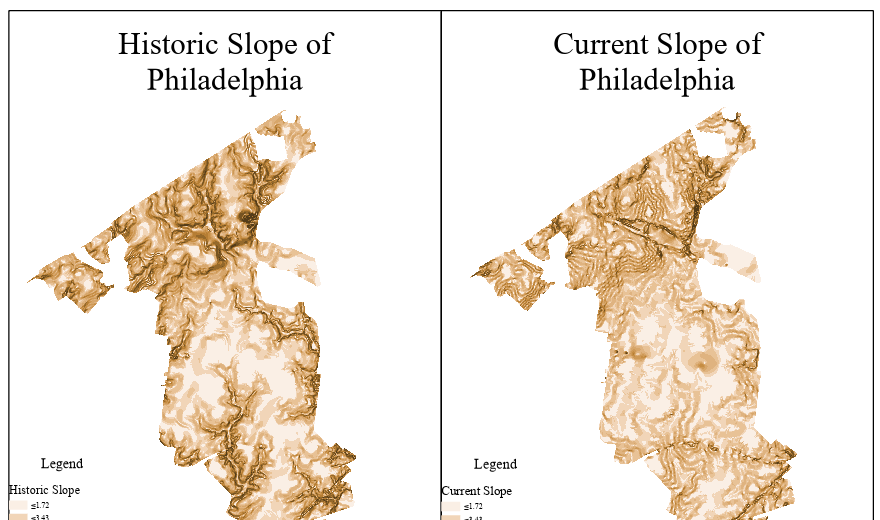
GIS 351 Midterm Selected Maps
A skill we practiced heavily in Spatial Analysis was creating high quality maps that display data in the best way. I had to practice how to best format map elements without leaving large gaps of blank spaces. When you have an oddly shaped area you’re focusing on, it can be hard to use an entire map area. By my midterm, I began improving the format of my maps and began understanding how to use space without overcrowding my maps.